- 27
- Apr
What are the Basic Concepts of Optics?
What are the Basic Concepts of Optics?
Light can be characterized by physical quantities such as wavelength (λ), frequency (v), and speed (c). The speed of light in a vacuum is a constant, denoted by c, and its approximate value is 299,792,458 meters per second (or approximately 3 × 10^8 m/s). The relationship between wavelength, frequency, and speed can be described by the equation λ = c/v.
According to the International System of Units, wavelengths are commonly expressed in units such as nanometers (nm), micrometers (µm), millimeters (mm), meters (m), and kilometers (km). Frequencies, on the other hand, are typically measured in hertz (Hz). These units are used to describe electromagnetic radiation that is visible to the human eye, known as visible light. Visible light corresponds to a wavelength range of approximately 380 to 780 nm in vacuum, with a corresponding frequency range of approximately 3.8 × 10^14 to 7.9 × 10^14 Hz.
The colors perceived by the human eye from 380 to 780nm are purple, blue, green, yellow, orange, and red. The electromagnetic spectrum is shown in Figure 1-1.

What is the spectrum of the optics?
The intensity of radiation is plotted into a spectrum by wavelength or frequency (wavelength is generally used), which is called a spectrum.
What is difference between relative spectrum and absolute spectrum ?
The light emitted by a light source can be represented by its spectral power distribution, denoted as P(λ), where λ represents the wavelength. The spectral power distribution refers to the energy of light at different wavelengths and is often referred to as the absolute spectrum. To normalize the spectrum, P(λ) is divided by its maximum value. The resulting normalized spectrum is called the relative spectrum, denoted as S(λ). The relationship between the relative spectrum and the absolute spectrum can be expressed as S(λ) = P(λ) / max[P(λ)].
To achieve normalization, the spectral power distribution, P(λ), is divided by the total energy of the light source so that the area under the curve becomes 1. The resulting spectrum is referred to as the isoenergy spectrum and is denoted as E(λ). The isoenergy spectrum represents the distribution of energy across different wavelengths. The relationship between the isoenergy spectrum and the absolute spectrum can be expressed as E(λ) = P(λ) / ∫₀ᴵ P(λ) dλ, where ∫₀ᴵ denotes integration from 0 to infinity.
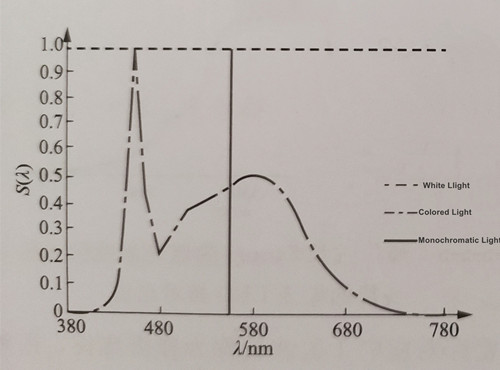
When the power of various wavelengths in a beam of light is roughly equal, it is called white light; if the energy distribution of each wavelength is uneven, it is called colored light; When the energy of the wavelength is zero, it is called monochromatic light. The relative spectral energy distribution of these three types of light is illustrated in Figure 1-2.
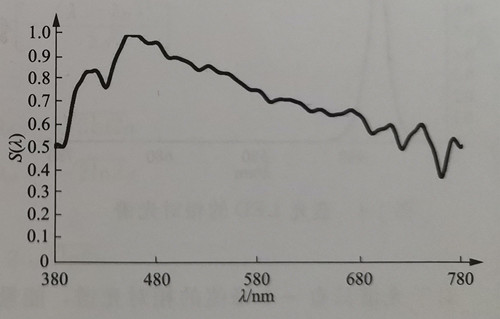
It is important to note that ideal white light and monochromatic light do not exist in practice. For instance, the average spectrum of sunlight passing through the atmosphere, known as the recombined sunlight spectrum, is shown in Figure 1-3.For monochromatic light sources, a certain spectral width generally exists. In practical scenarios, various factors can cause spectral broadening effects.For example, in semiconductor luminescence, the transition of electrons from the valence band to the conduction band occurs within a specific energy range, resulting in different transition energy values.
In addition, what cannot fundamentally be avoided is the natural broadening of the spectrum. According to the Heisenberg uncertainty principle in quantum mechanics, there is the following relationship between the uncertainty △E of an excited state energy and the average lifetime △t of electrons in this energy state as follows △E·△t≥ ℏ/2. Here, ℏ represents the reduced Planck’s constant, which is related to Planck’s constant h (6.63×10⁻³⁴ J·S) as ℏ = h/(2π). For electromagnetic waves, energy can be expressed as the product of Planck’s constant and frequency: E = hv. By differentiating both sides, we obtain △E = h △v.
Similarly, by differentiating the equation λ = c/v on both sides, we can derive △λ = -|c/v^2 · △v| = -|λ^2/(c · △v)|. In this equation, the negative sign indicates a negative correlation between the two variables, which can be omitted during calculations.
From the formula △E · △t ≥ ℏ/2, where ℏ = h/(2π), and △E = h △v, we can simply obtain △λ = -|c/(v^2) · △v| = -|λ^2/(c · △v)|. By rearranging the equation, we find △λ ≥ λ^2 / (4c △πt).
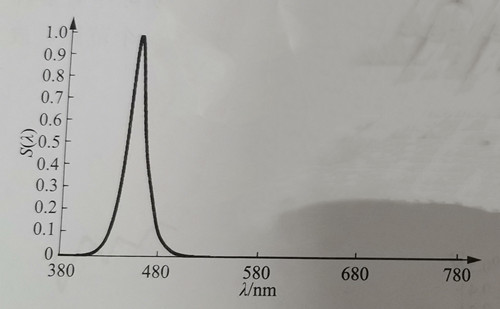
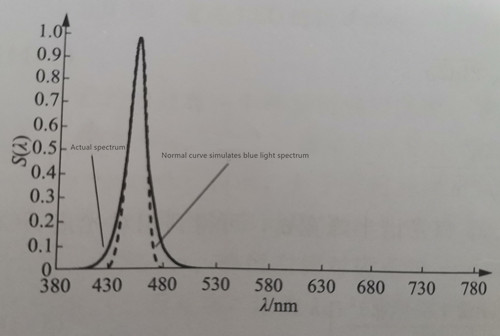
The average lifetime of an electron in an excited state is typically around 10^(-8) seconds. By substituting the formula △λ ≥ λ^2 / (4c △πt), we can estimate the spectral broadening to be approximately 5.4 × 10^(-6) nm. This value is relatively very small compared to the width of several nanometers typically observed in semiconductor monochromatic light sources. Therefore, spectral natural broadening is usually not the dominant factor. Figure 1-4 illustrates the relative spectrum of a typical blue LED with a peak wavelength of 450 nm.
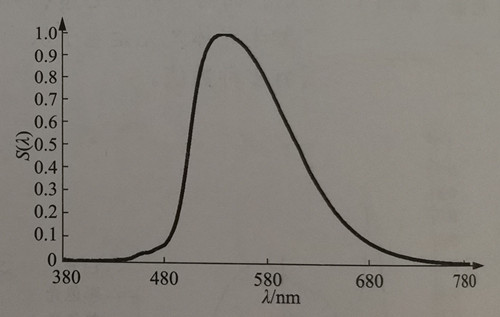
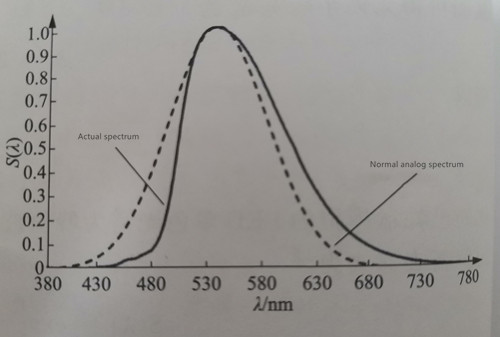
When monochromatic light is produced through the conversion of phosphor powder excited by a blue light chip, the resulting spectrum tends to be wider. For instance, Figure 1-5 illustrates the relative spectrum of a green LED generated through the conversion of phosphor powder excited by blue light, with a peak wavelength of 540 nm.
For a relative spectrum with only one peak, the wavelength at which the energy density corresponds to 1 is referred to as the peak wavelength, represented by the symbol λP (Peak Wavelength). Additionally, the dominant wavelength can be determined from the relative spectrum, denoted by the symbol λD (Dominant Wavelength). The definition and calculation method for the dominant wavelength will be explained later.
Furthermore, in the case of a single-peak spectrum, the width of the spectrum can be characterized by the spectral half-width known as FWHM (Full Width Half Maximum), denoted as σ, and measured in units of nm. The left side of the peak corresponds to the wavelength where the relative spectral value is 0.5, represented as λL, while the right side of the peak corresponds to the wavelength where the relative spectral value is 0.5, represented as λR. The spectral half-peak width can then be calculated using the formula σλ = λR – λL. The meaning of this measurement is illustrated in Figure 1-6.
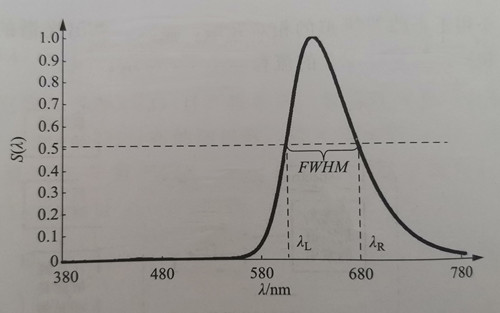
The FWHM of the blue light shown in Figure 1-4 is approximately 18 nm, while the FWHM of the green light shown in Figure 1-5 is around 108 nm. In comparison, the typical spectral half-maximum width (FWHM) for green LEDs directly emitted by ordinary chips is 30-40 nm. It is evident that the half-peak width of the monochromatic spectrum obtained through the conversion of blue light-excited phosphors is significantly larger. When used for displays, this larger spectral half-peak width results in a smaller color gamut. The concept of color gamut will be explained in the subsequent section on colorimetry.
Relative spectra are typically obtained through testing, theoretical calculations, or simulations. Analytical expressions are usually unavailable, and often only discrete data points are available. For the visible light range up to -780 nm, there are typically 81 or 401 data points. In photometric and chromaticity calculations, the data is commonly used at 1 nm intervals, providing sufficient accuracy. If spectral data is only available at 5 nm intervals, cubic spline interpolation can be employed to approximate the data at approximately 1 nm intervals.
For the relative spectrum of a monochromatic LED, a first-order approximation can be achieved by expressing it with the probability density curve of a normal distribution. This allows it to be described using two quantities: the peak wavelength (λP) and the half-peak width (σλ) of the spectrum. This approach provides great convenience in simulating the relative spectrum of the LED. The probability density function of the normal distribution is given by f(x) = (1/√(2πσ)) * exp[-((x-u)^2)/(2σ^2)], with an area under the curve equal to 1.
To simulate the relative spectrum using this curve, the coefficient in front of the exponent is removed to obtain S(λ) = exp[-((λ-λP)^2)/(2σ^2)]. By solving S(λ) = 0.5, the values of λL = λP – √(2ln2)σ and λR = λP + √(2ln2)σ can be obtained. Consequently, the spectral half-peak width σλ can be calculated as σλ = 2√(2ln2). This allows us to define σ = σλ/√(2ln2).
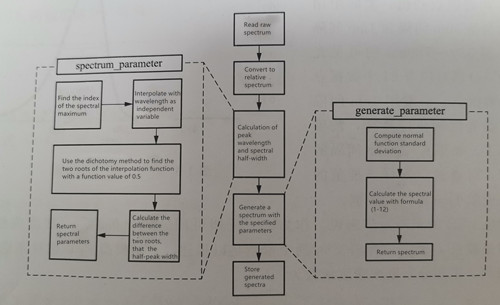
Thus, for simulating the monochromatic LED spectrum, we need to know the peak wavelength (λP) and the spectral half-peak width (σλ). The relative spectrum S(λ) can be represented as S(λ) = exp[-((4ln2)(λ-λP)^2)/(σλ^2)]. The blue light spectrum’s normal approximation simulation curve, as shown in Figure 1-4, can be generated using the Python program 1.1.1. The program reads a single-peak spectrum with 1 nm intervals, and outputs a simulated relative spectrum using a normal curve. The input and output spectra have the same peak wavelength (λP), and the spectrum’s half-peak width (σλ) remains consistent. The flow of program 1.1.1 is illustrated in Figure 1-7.
In Figure 1-8, a comparison is presented between the actual spectrum and the simulated spectrum. The solid line represents the actual spectrum of monochromatic blue light, while the dotted line represents the normal simulated spectrum. It can be observed that the simulation effect is excellent above the half-peak value, and the simulated spectrum closely matches the actual spectrum. However, below the half-peak value, the actual spectral intensity value decreases slowly with increasing wavelength, indicating the presence of a tail-broadening phenomenon when compared to the normal curve.
Similarly, the normal approximate simulation curve of the monochromatic green light spectrum converted by the phosphor powder shown in Fig. 1-5 can be generated, as shown in Fig. 1-9. The solid line is the actual spectrum of monochromatic green light, and the dotted line is the normal simulated spectrum. It can be seen that the simulation effect is not very good in the entire spectral range. The actual spectrum is opposite to the simulated spectrum, and the left and right are asymmetrical, with the peak point as the center. It has been rotated counterclockwise by a certain angle, or the peak of the actual green light spectrum is somewhat leftward.
To assess the closeness of the actual spectrum to the normal simulation, statistical methods such as skewness and kurtosis tests commonly used for normal distribution fitting can be considered. In this context, the wavelength (λ) is treated as a random variable, and the equal-energy spectrum E(λ)d is regarded as a probability density. Let F(λ) be the distribution function, defined as F(λ) = ∫₃₈₀ λE(x)dx. It is known that F(λ) is a strictly monotonically increasing function, and its inverse function G(λ) is also strictly monotonic.
Applying the theory of inverse transformation sampling in mathematical statistics, we can generate n random numbers uniformly distributed on the interval [0,1], and substitute them into the inverse function G(λ). This process yields n random numbers that follow the distribution F(λ) with a probability density of E(λ). Suppose these n random numbers are denoted as λ₁, λ₂,…, λₙ. The skewness G₁ and kurtosis G₂ of the sample can then be calculated as G₁ = B₃/(3√(2B₂)), G₂ = B₄/(2B₂), where Bₖ = (1/n) ∑ᵢ₌₁ⁿ(λᵢ – λ)ᵏ, and -λ represents the sample mean, specifically -λ = (1/n) ∑ᵢ₌₁ⁿ λᵢ.
When the assumption that E(λ) follows a normal distribution holds true and n is sufficiently large, it can be shown that G₁ approximately follows a normal distribution with mean 0 and variance 6(N – 1)/((n + 1)(n + 3)), and G₂ approximately follows a normal distribution with mean 3 – 6/(n + 1) and variance [24(n – 2)(n – 3)]/((n + 1)²(n + 3)(n + 5)).
In the following test, the null hypothesis (H₀) assumes that E(λ) follows a normal distribution. In this case, the standard deviations are given by σ₁ = √[6(n – 2)]/((n + 1)(n + 3)) and σ₂ = √[24n(n – 2)(n – 3)]/[(n + 1)²(n + 3)(n + 5)]. Furthermore, u₂ = 3 – 6/(n + 1), U₁ = G₁/σ₁, and U₂ = (G₂ – u₂)/σ₂.
When H₀ is true and n is sufficiently large, U₁ approximately follows a standard normal distribution (N(0,1)), and U₂ approximately follows a standard normal distribution (N(0,1)). Taking a significance level (α), the rejection region for H₀ is given by |U₁| ≥ k₁ or |U₂| ≥ k₂, where k₁ and k₂ can be determined by the following formulas: P₀H{|U₁| ≥ k₁} = α/2 and P₀H{|U₂| ≥ k₂} = α/2. Using these probabilities, we can set k₁ = Za/4 and k₂ = Za/4, where Za/4 represents the (α/4)th quantile of the standard normal distribution. Typically, if a significance level of α = 0.1 is chosen, Za/4 ≈ 1.96. Therefore, if |U₁| ≥ 1.96 or |U₂| ≥ 1.96, the null hypothesis H₀ should be rejected at the α significance level, suggesting that E(λ) does not follow a normal distribution and should not be approximated by a normal curve.
To characterize the closeness between the simulated spectrum and the actual spectrum, it is preferable to use alternative methods for comparing spectral differences, rather than solely relying on comparing differences with the normal curve. In this regard, one effective approach is to use the phase difference △E of the isoenergy spectrum.
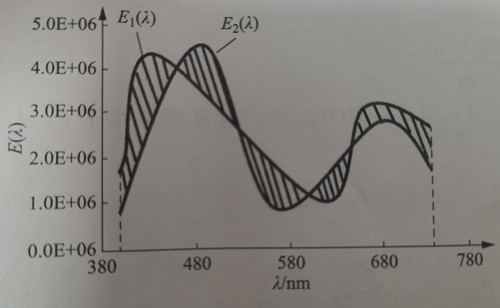
Assuming two equal-energy spectra E1(λ) and E2(λ), the relative difference can be calculated as △E = ∫[|E1(λ) – E2(λ)|dλ] / ∫[E1(λ) + E2(λ)dλ]. From the definition of equal-energy spectrum, we know that the denominator in the formula △E = ∫[|E1(λ) – E2(λ)|dλ] / ∫[E1(λ) + E2(λ)dλ] is equal to 2. Hence, △E simplifies to △E = 1/2∫|E1(λ) – E2(λ)|dλ.
The meaning of the formula △E = 1/2∫|E1(λ) – E2(λ)|dλ is illustrated in Figure 1-10. △E represents the percentage of the area formed by the difference between the two curves to the total area enclosed by the two curves. The integral in the formula, ∫|E1(λ) – E2(λ)|dλ, yields the shaded area shown in the figure. It is important to note that the formula considers the use of equal-energy spectra, and the unit of the independent variable integration is denoted by m. Since the area under each spectrum is normalized to 1, the values on the ordinate may appear relatively large.
When comparing the difference between two spectra, the use of the isoenergy spectrum instead of the absolute spectrum P(λ) or the relative spectrum S(λ) can be explained as follows. Without considering absolute spectra, it is possible to encounter scenarios where two spectra have the same relative spectrum but different absolute spectra. In colorimetry, it is known that almost all the chromaticity characteristics of the two spectra are the same, despite their differing absolute spectra. Hence, directly comparing absolute spectra does not provide meaningful insights from a colorimetric perspective.
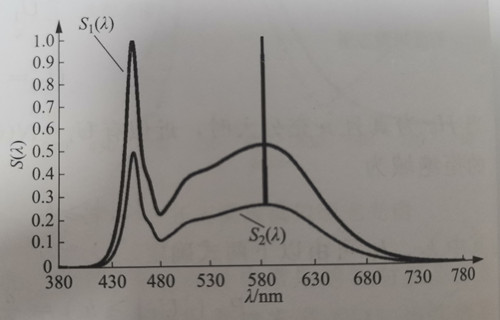
The relative spectrum only normalizes the peak value, and different relative spectra may still contain varying light energies. It is conceivable that two relative spectra, S1(λ) and S2(λ), may not completely overlap in terms of their shape, but most of their chromatic characteristics are very similar. Consider the scenario depicted in Figure 1-11, where the intensity values of each wavelength in S2(λ) are half of those in S1(λ), with only a single value of 1 at 584 nm. Although there is twice the difference in light energy between the two spectra, their chromaticity characteristics remain nearly identical. However, if the relative spectrum is used to represent the spectral difference, the difference area would still appear significant.
In summary, the use of the isoenergy spectrum allows for a more meaningful comparison of spectral differences, as it takes into account both the shape of the spectrum and the light energy contained within it.
To compare the difference between the normal curve simulation of the LED monochromatic spectrum and the measured spectrum, we can use the quantity △E to assess their closeness. In this context, we will calculate △E between the simulated spectrum and the actual spectrum shown in Figure 1-8 and Figure 1-9, respectively. To perform this calculation, we will utilize Python program 1.1.2.
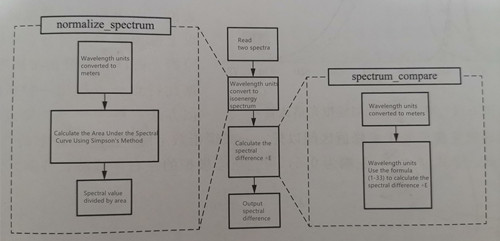
The purpose of program 1.1.2 is to read two spectra with 1nm spacing, convert them into equal energy spectra using the formula E(λ) = P(λ) / ∫₀ˡ P(λ)dλ, and then calculate △E using the formula △E = 1/2∫|E1(λ) – E2(λ)|dλ. The program will output the calculated value of △E. The flow of program 1.1.2 is illustrated in Figure 1-12.
By running the program, the calculated differences are 0.182 and 0.155 for the respective spectra. It is important to note that △E ranges from a minimum value of 0 to a maximum value of 1. In the case of ideal white light or ideal monochromatic light, △E would be equal to 1.
There are also some second-order approximations if you want to simulate the LED single-peak spectrum more preparedly. One approach is to use the double Gaussian model, where the relative spectrum S(λ) is given by S(λ) = (G(λ) + 2G5(λ))/3. In this model, G(λ) is defined as G(λ) = exp[-(λ – λp)²/σλ²]. The formula demonstrates a high degree of fitting between the model and the actual LED single-peak spectrum, with an R² value of 0.9913 indicating a strong fit.
However, a limitation of this model is that the actual spectral half-width of the simulated spectrum does not match the simulated spectrum itself. This approach is commonly referred to as the Guo method. To address this issue, we have conducted careful studies on the effect of the actual spectral band tail width. By incorporating the exponential part of the normal simulation into the attenuation factor, we can achieve a slower decline towards the end and a closer resemblance to the actual spectrum. The modified formula is as follows: S(λ) = exp{-3.2213/[(λ – λp)²/σλ]} * exp{-0.3|[(λ – λp)/σλ|}.
If these two models are utilized to simulate the blue and green light spectra depicted in Figure 1-4 and Figure 1-5, respectively, the resulting simulation outcomes are shown in Figure 1-13.

In Figure 1-13, the solid line represents the original relative spectrum, while the dotted line represents the simulated spectrum using the Guo method, and the dashed line represents the simulated spectrum using the Shen method. It is evident that both the Guo method and the Shen method yield better simulation effects for the blue light spectrum emitted directly by the chip. However, when it comes to the green light spectrum excited by the chip, the Guo method exhibits a stronger left band tail while the right band tail is not sufficiently expanded.
By conducting calculations, it was determined that the difference △E between the spectrum simulated using the Guo method or the Shen method and the original spectrum is 0.102 and 0.150, respectively. These values indicate an improvement of 44.0% and 17.6% compared to pure distribution simulation. On the other hand, the difference △E between the spectrum simulated using the Guo method or the Shen method and the original green light spectrum is 0.160 and 0.159, respectively, showing minimal difference between the two methods.
For the chip-emitted spectrum that exhibits relative symmetry, the normal simulation method generally provides a good simulation effect above the half-peak value. However, it often fails to capture the obvious band-tail broadening observed in the original spectrum below the half-peak value. To address this limitation, a new second-order approximation method called piecewise second-order approximation is proposed.
The principle of the piecewise second-order approximation is as follows: When the corresponding wavelength of the simulated spectrum falls outside the half-peak range, the exponential decline rate is slowed down, and the quadratic form of the index is changed to a linear form. The formula S(λ) = exp[-|4ln2(λ – λp)²/σλ²|] is used for the spectrum within the half-peak range, where the left and right half-peak wavelengths of the normal simulation are obtained as λ’L = λp – (1/2)σλ and λ’R = λp + (1/2)σλ. For λ in the range [λ’L, λ’R], the spectrum follows the formula S(λ) = exp[-|4ln2(λ – λp)²/σλ²|].
To construct the spectrum outside the half-peak range, specific formulas are employed. For λ in the range [380, λ’L], the spectrum is constructed using the formula S(λ) = 0.5exp[-aL(λ’L – λ)]. Similarly, for λ in the range [λ’R, 780], the spectrum is constructed using the formula S(λ) = 0.5exp[-aR(λ – λ’R)], where aL and aR are fitting coefficients.
Figure 1-14 illustrates the results of simulating the blue and green light spectra shown in Figure 1-4 and Figure 1-5 using the piecewise second-order approximation method.
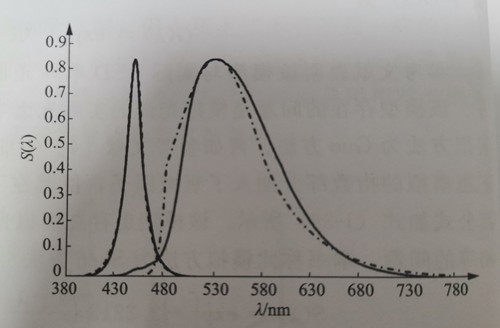
Among them, for blue light, the fitting coefficient aL=aR=1, and for green light, the fitting coefficient aL=0.2, aR=0.02. The difference △E between the simulated spectrum and the original spectrum is 0.03 and 0.08, which is 83.5% and 48.4% better than the pure normal distribution simulation, and has a very high degree of approximation.
However, it is important to note that the piecewise approximation method has a significant limitation. Since the shape of the actual spectrum is often unknown when simulating a spectrum, it becomes challenging to determine the appropriate fitting coefficients aL and aR. In the example provided, the symmetry of the spectrum allowed for equal fitting coefficients in the case of blue light, while green light required a faster decline on the left side and a slower decline on the right side.
Segmented simulation is generally more suitable for LEDs that emit light directly from chips, rather than monochromatic light excited by phosphors. In practical applications, if the spectrum of a certain sample has been measured and there is a need to simulate the variability of product discreteness or other parameters such as peak wavelength or spectral half-maximum width, the measured spectrum can serve as the basis for calculations. This approach, known as the third-order approximation, often yields higher simulation accuracy.
It is worth noting that the shape of the measured spectrum remains unchanged in the third-order approximation, with different peak wavelengths achieved by shifting the wavelength coordinates. In the subsequent calculation examples, we will provide a specific case of chromaticity calculation for a smart bulb lamp, where the third-order approximation will be employed.
